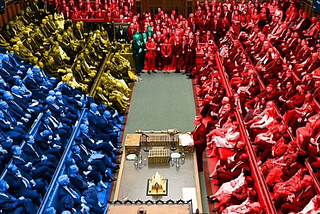
Andrew MossI’ve Just Discovered a New Chart, and It’s Well-Suited to PoliticsThe UK general election has just been, but the results map paints a confusing picture.Jul 11Jul 11
Andrew MossAbsolute Table Column References Need a Syntax UpdateWhat could this change look like?Jun 22Jun 22
Andrew MossExcel Desperately Needs New Decimal ButtonsI know barely anyone willing to defend them.Mar 29Mar 29
Andrew MossCould This Be the Future for Excel’s Calculation Engine?Just an outrageous idea I’m mooting… Ever since Excel burst onto the scene, it’s been based on a worksheet grid. Each cell in that grid…Jan 4Jan 4
Andrew MossExcel Gets Sheets-Esque CheckboxesA long overdue update arrives for Office Insiders.Oct 7, 2023Oct 7, 2023
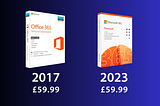
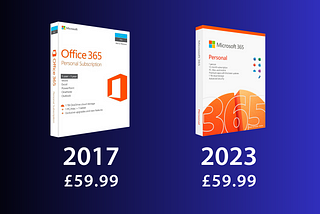
Andrew MossWhy Has the Price of a Microsoft 365 Subscription Not Budged?That’s despite global inflation and the dramatic improvements Excel has seen.Sep 4, 2023Sep 4, 2023
Andrew MossinCodeXA simple guide to web scraping in Power AutomateHow to extract Microsoft MVP data.Nov 1, 20221Nov 1, 20221
Andrew MossHow to Join the Office Insider ProgramBe amongst the first to test new features.Jul 28, 2022Jul 28, 2022